Discover the News Impact on Forex Market!
Study the historical charts of more than 70 economic indicators and analyze the historical price action of more than 30 Forex pairs.
In a few words...
-
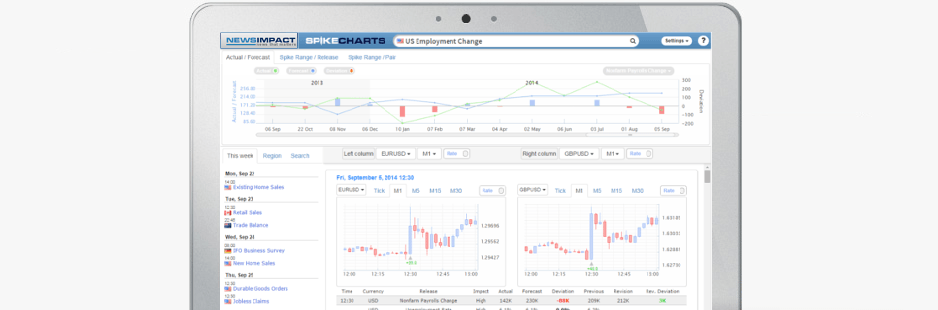
SpikeCharts provides historical Forex market data through chart snapshots centered on major economic news events. Forex traders can analyze the performance of various pairs through these charts and see how economic indicators impact Forex pairs. SpikeCharts is an invaluable resource for every Forex news trader.
-
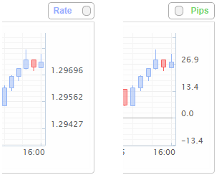
Pips vs Rate
Effortlessly toggle between viewing actual prices and market movements expressed in pips, enabling a clearer understanding of market dynamics.
-
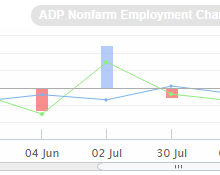
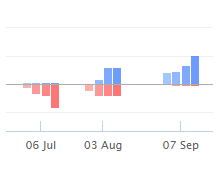
Historical deviations
The essence of SpikeCharts! Access historical, actual, and deviation data for each news release in one detailed chart, providing you with full insight to inform your decisions.
-
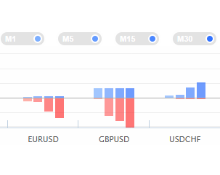
Pair performance
Instantly compare currency pairs to identify which experienced the most significant movement across various time frames (M1, M5, M15, and M30), simplifying your analysis.
-
Historical releases
Leverage historical news releases to gain insights into how they have historically influenced currency pair price movements, enhancing your strategy development.
-
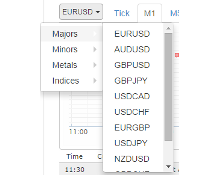
Available pairs
Access data for over thirty currency pairs for every news release since 2010, ensuring a broad spectrum of information at your fingertips.
-
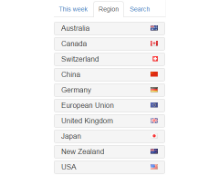
Indicators
Benefit from extensive coverage of economic indicators from multiple economic regions, offering a wide-angle view on global economic health.
-
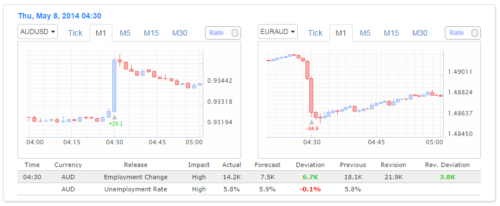
Side by side
Eliminate the need to switch between charts by comparing two pairs side by side, across multiple time frames, including tick resolution, for a more efficient analysis process.
-
Pricing details
-
FREE VERSION PREMIUM VERSION FREE $20/mo  Multiple time-frame charts of more than 30 Forex pairs
Multiple time-frame charts of more than 30 Forex pairs
Multiple time-frame charts of more than 30 Forex pairs
 Select Economic Indicators
 US Employment Change
 EU Minimum Bid Rate
 AU GDP
Unrestricted access to all available economic indicators
AU GDP
Unrestricted access to all available economic indicators
70 economic indicators
10 economic regions
Limited to 1 Year of historical data
Historical data since 2010
-